March 2024
The Benefits of Comprehensive, Automated Marketing Reports
What do you do when no single marketing reporting tool delivers the data you want? You build your own, custom marketing report.
That’s what Gemini decided to do after years of frustration with data points that were all in different places. While we were able to aggregate our data, we envisioned a more cohesive report that better matched our clients’ needs. We also wanted to automate the reporting process with a template that was customizable and would evolve with an ever-changing digital marketing landscape.
It took the better part of a year to design, build and launch a digital marketing report that reflected our agency’s and clients’ desire for more detailed and insightful data. In this blog, we’ll cover the steps we took to elevate and customize our marketing reporting.
THE IMPORTANCE OF MARKETING REPORTING
An effective marketing report tells a story. Through the right key performance indicators (KPIs), channel performance metrics and visuals, it shows how your marketing efforts are performing and, most importantly, how they affect business. This data can mean different things to clients and to marketers.
FOR YOUR CLIENTS
Marketing reports offer transparent insights into how a client’s investments are performing. Client-facing reports should be easy to read with the metrics that the client values most clearly highlighted. These metrics should clearly speak to the return on investment (ROI) the client is getting and show the direct impact the marketing efforts have had on business goals over time.
For further clarity, marketing channel specialists should provide context alongside the data visualization. Finally, clients should be able to use reporting to allocate resources more effectively and adjust strategies for optimal results.
FOR MARKETERS
Reports with clear, accurate data are indispensable for marketing agencies when reviewing their strategies, assessing the effectiveness of various channels and identifying areas for improvement. By analyzing performance trends over time, marketers can hone in on the tactics that have proven most effective. When communicating with a client, marketing reports provide an opportunity for agencies to showcase their expertise and lead the conversation around next steps. Furthermore, reporting fosters a trust-based relationship through transparency and accountability.
WHAT EFFECTIVE MARKETING REPORTING DOES
A “good” marketing report is much more than a collection of data and graphs. It’s a roadmap for achieving business goals. It harmoniously weaves the narrative of numerous marketing campaigns together into a tapestry that explains how a business is meeting its overall objectives.
9 ELEMENTS OF A SUCCESSFUL DIGITAL MARKETING REPORT
- Executive Summary: A clear and concise summary of achievements and recommendations allows stakeholders to quickly grasp the report’s value without delving into the details.
- Channel Breakdowns: Knowing which channels are contributing to the marketing funnel and the customer journey along with the impacts of each is key to understanding your programs.
- Key Performance Indicators (KPIs): There is no shortage of measurable marketing metrics. Reports need to showcase the significant KPIs that measure success against the predefined objectives.
- Channel Analysis: Data is only as helpful as the context built around it. Reporting requires a detailed analysis of each marketing channel to provide the insights that will inform decisions and next steps.
- ROI Analysis: Data must be translated into a return on investment for each marketing channel so clients or stakeholders see the tangible value generated from their marketing spend.
- Comparative Analysis: Comparing data over specific time periods reveals the trends and patterns necessary to building a strategy of growth.
- Visuals: Charts, graphs and trend lines convey complex information more effectively than text alone. They give a “big picture” view of marketing efforts.
- Customizable: An effective report allows you to review, organize and curate your data, all in one place. You should be able to easily adjust the data displayed to accommodate the person reading the report.
- Recommendations: Data and analysis inform actionable recommendations for future marketing efforts. Reporting should be a blueprint for the path forward.
Marketing reports should present the most accurate snapshot of your marketing efforts without human error or guesswork.
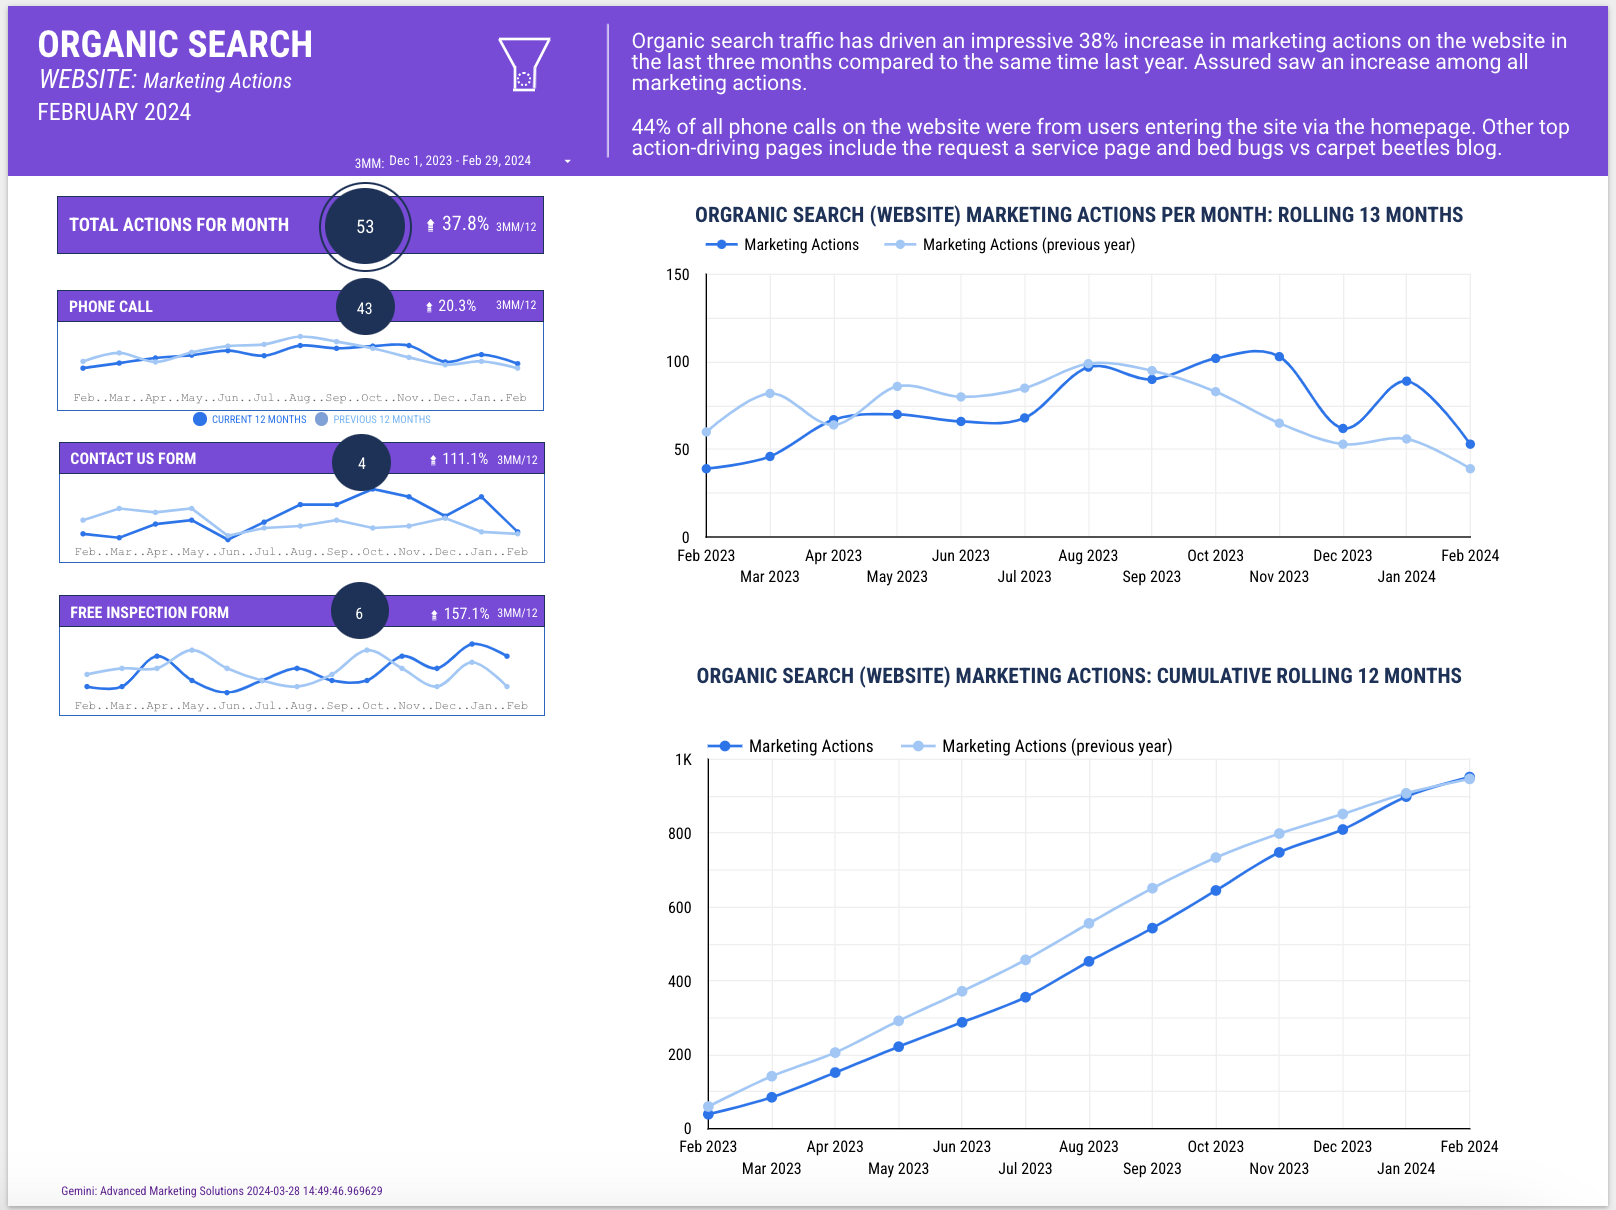
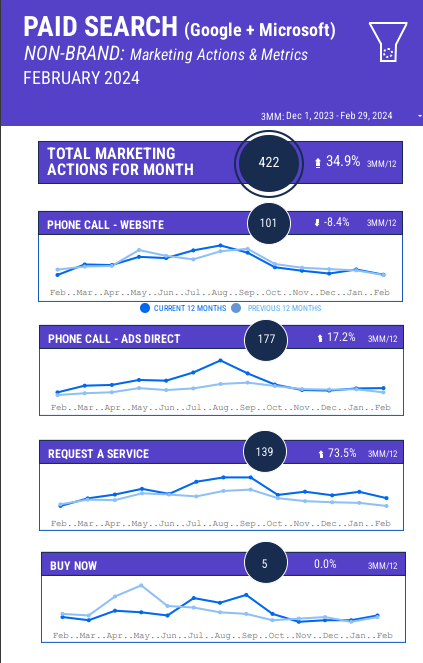
For example: Your report should go beyond how many marketing actions you had in a given month. It should explain where those marketing actions came from, the customer behaviors behind them, how the metric compares to previous periods and what strategies were successful. Incorporating this information allows you to build a marketing strategy that is based on concrete evidence. It also makes the case for pivoting if current tactics don’t deliver the desired results.
HOW WE BUILT GEMINI’S MARKETING REPORT TEMPLATE
INTEGRATING DATA: FINDING THE RIGHT PLATFORM
Organizing and structuring huge amounts of data for multiple clients is no easy task. To funnel all of our metrics into one location, we needed an application that could integrate data from several sources, allow us to customize the display and automate the process. For this, we turned to Looker Studio.
Looker Studio (formerly known as Google Data Studio) is a powerful data visualization tool designed for converting data into customizable reports and dashboards. Its biggest selling point was its ability to integrate seamlessly with various data sources, including:
- Google Analytics
- Google Ads
- Google Business Profile
- Google Sheets
- Microsoft Ads
- Facebook Ads
- SEMrush Domain Analytics
- SEMrush Position Tracking
- LinkedIn Ads
- Local Service Ads (LSA)
- TikTok
- Other structured query language (SQL) databases
This enabled us to aggregate data for a comprehensive and historical view of performance metrics across different platforms. From there we could create customized reports and dashboards with the charts, graphs and tables that would best represent the data.
ADAPTING TO GA4: DATA WAREHOUSING AND BLENDING
Google’s announcement that they would be switching from Universal Analytics (UA) to Google Analytics 4 (GA4) created a whole another obstacle. Years of UA data would be lost if we didn’t find a way to store it and figure out how to blend it with incoming data from GA4. Because our specialists rely on that historical data for reporting and to measure performance, we formulated a plan to migrate all of our client’s UA data. The task proved slow and difficult but our team was able to find the right tools and path to accomplish the feat.
Ultimately, figuring out how to store UA data and blend it with GA4 for seamless year-over-year comparisons is one of the biggest strengths of our new reporting. This capability makes our reporting more comprehensive than others who lost their data and were forced to start fresh with GA4.
SCALING REPORTING: CUSTOMIZATION FOR EACH CLIENT
With the analytics challenges solved, we had a marketing report template that automatically integrated data from multiple sources and compiled it accurately in one place. We just needed to personalize the display for each of our clients so that they had the data they wanted in a format that was easy to understand. To ensure reporting for each client was clear, accurate and helpful, we went through several rounds of quality assurance checks before launching.
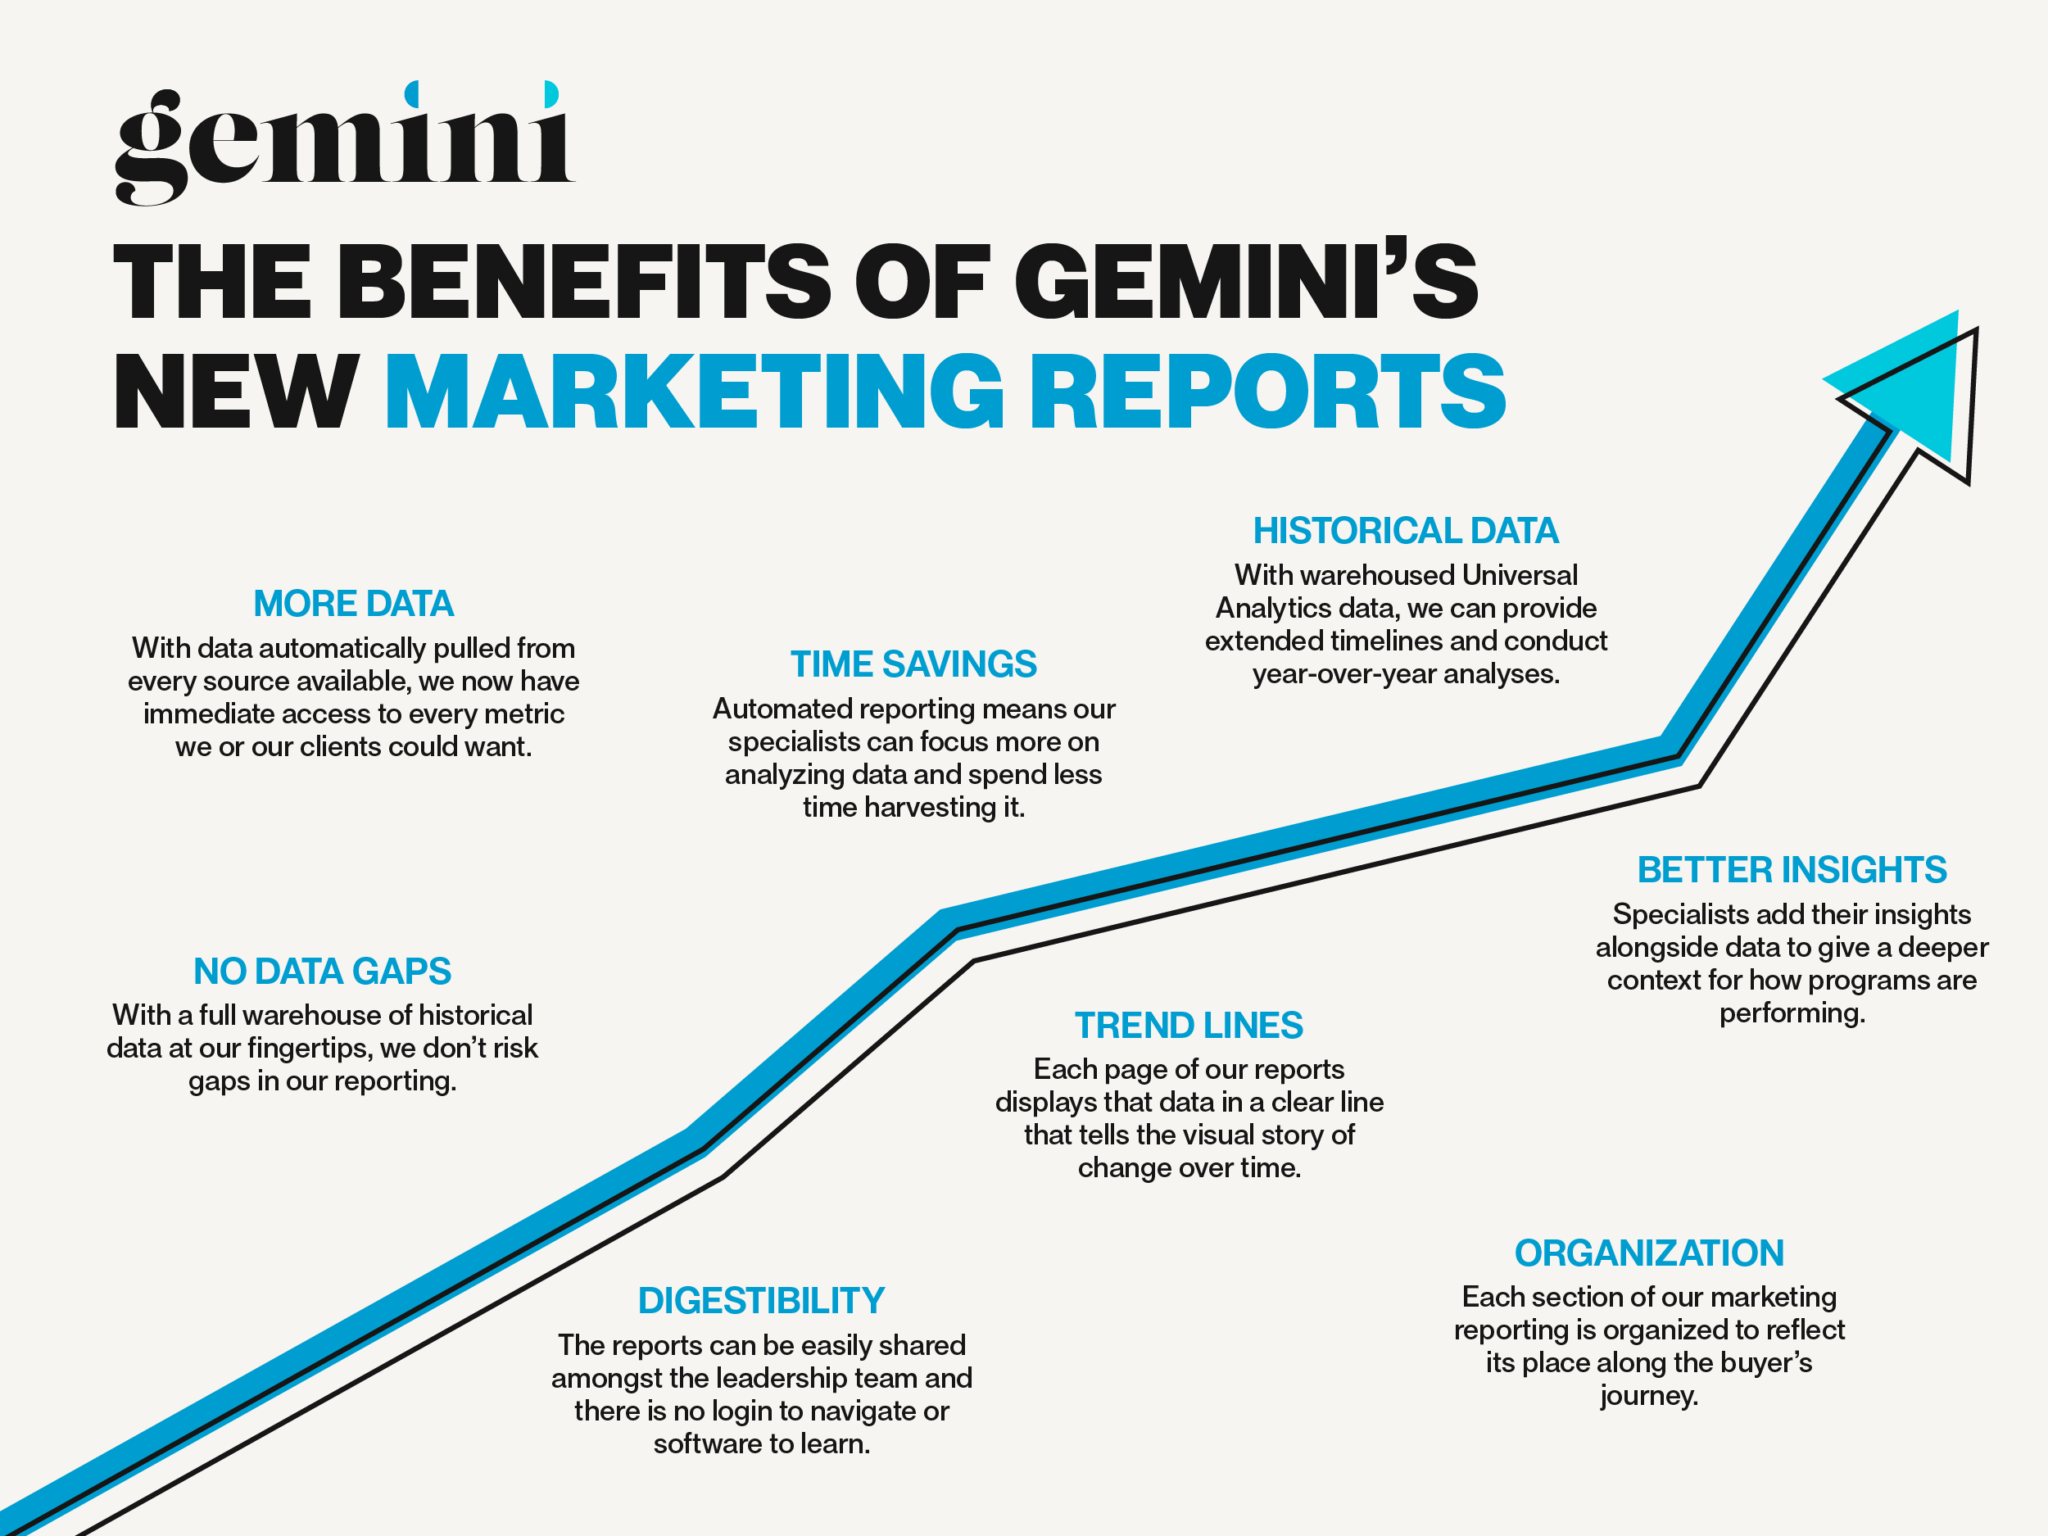
THE BENEFITS OF OUR NEW MONTHLY PERFORMANCE AND INSIGHTS REPORTS
The year-long effort we put into our digital marketing report was beyond worth it. Here’s why:
MORE DATA
With data automatically pulled from every source available, we now have immediate access to every metric we or our clients could want. We no longer risk incomplete narratives around our campaigns. Most importantly, more data means better-informed decisions.
NO DATA GAPS
With a full warehouse of historical data at our fingertips, we don’t risk gaps in our reporting. This sets us apart from legacy reports that rely on month-over-month (MoM) or year-over-year (YoY) comparisons. This allows for unlimited ways to compare and analyze performance across channels and time periods.
TIME SAVINGS
Automated reporting is a huge time saver. Our specialists no longer have to comb through multiple data sources and paste results into a document every month. With data constantly pulled from all of the relevant sources and then aggregated into digestible monthly overviews, we can focus more on analyzing data and less on harvesting it.
HISTORICAL DATA BEFORE 2024
Because we were able to warehouse the Universal Analytics data for all of our clients and blend it with data from GA4, we can provide extended timelines and conduct year-over-year analyses.
BETTER INSIGHTS
With the new report, specialists can add their insights into a spreadsheet and have their comments automatically inserted into the reports alongside the data. This streamlined process creates a more comprehensive record of our marketing efforts and gives our clients a deeper context for how their programs are performing.
TREND LINES
Every metric has a trend line. Each page of our reports not only has the most comprehensive data available, it displays that data in a clear line that tells the visual story of change over time. We can customize the charts and lines in each report to speak directly to that client’s goals. Stakeholders can easily see specific impacts at specific times.
DIGESTIBILITY
We no longer need to use monthly meeting time to go over and explain reporting with clients. We send them an easy-to-read PDF to digest on their own time. The reports can be easily shared amongst the leadership team and there is no login to navigate or software to learn. Each report is laid out with the metrics they want based on their individual preferences. Now our meetings can be focused on strategy, collaboration and gaining a better understanding of our clients’ pain points.
ORGANIZATION
Each section of our reporting dashboard corresponds to a phase of the marketing funnel and reflects a place along the buyer’s journey. This new organization gives a clear overview of how Gemini’s marketing tactics all work together to achieve lead generation.
ELEVATE YOUR DIGITAL MARKETING REPORTING TOOLS
Great reporting gives you a competitive edge. It allows you to see trends, identify opportunities and plan strategies based on the most accurate data available. If you’re not getting the detailed reporting you need to grow, contact the pros at Gemini. We love to share our expertise with clients looking for greater accountability in their marketing agency.
Join the gemini newsletter
Stay up to date on all the latest news ranging from our industry to our agency!